S&P500 Golden Cross Historical Data Analysis: How Likely Is a Bull Market in 2026? A Complete Investor's Guide
In this article, you'll learn:
To all of you who want to be lazy but can’t, and those who can’t be lazy but desperately want to… today let’s talk about…
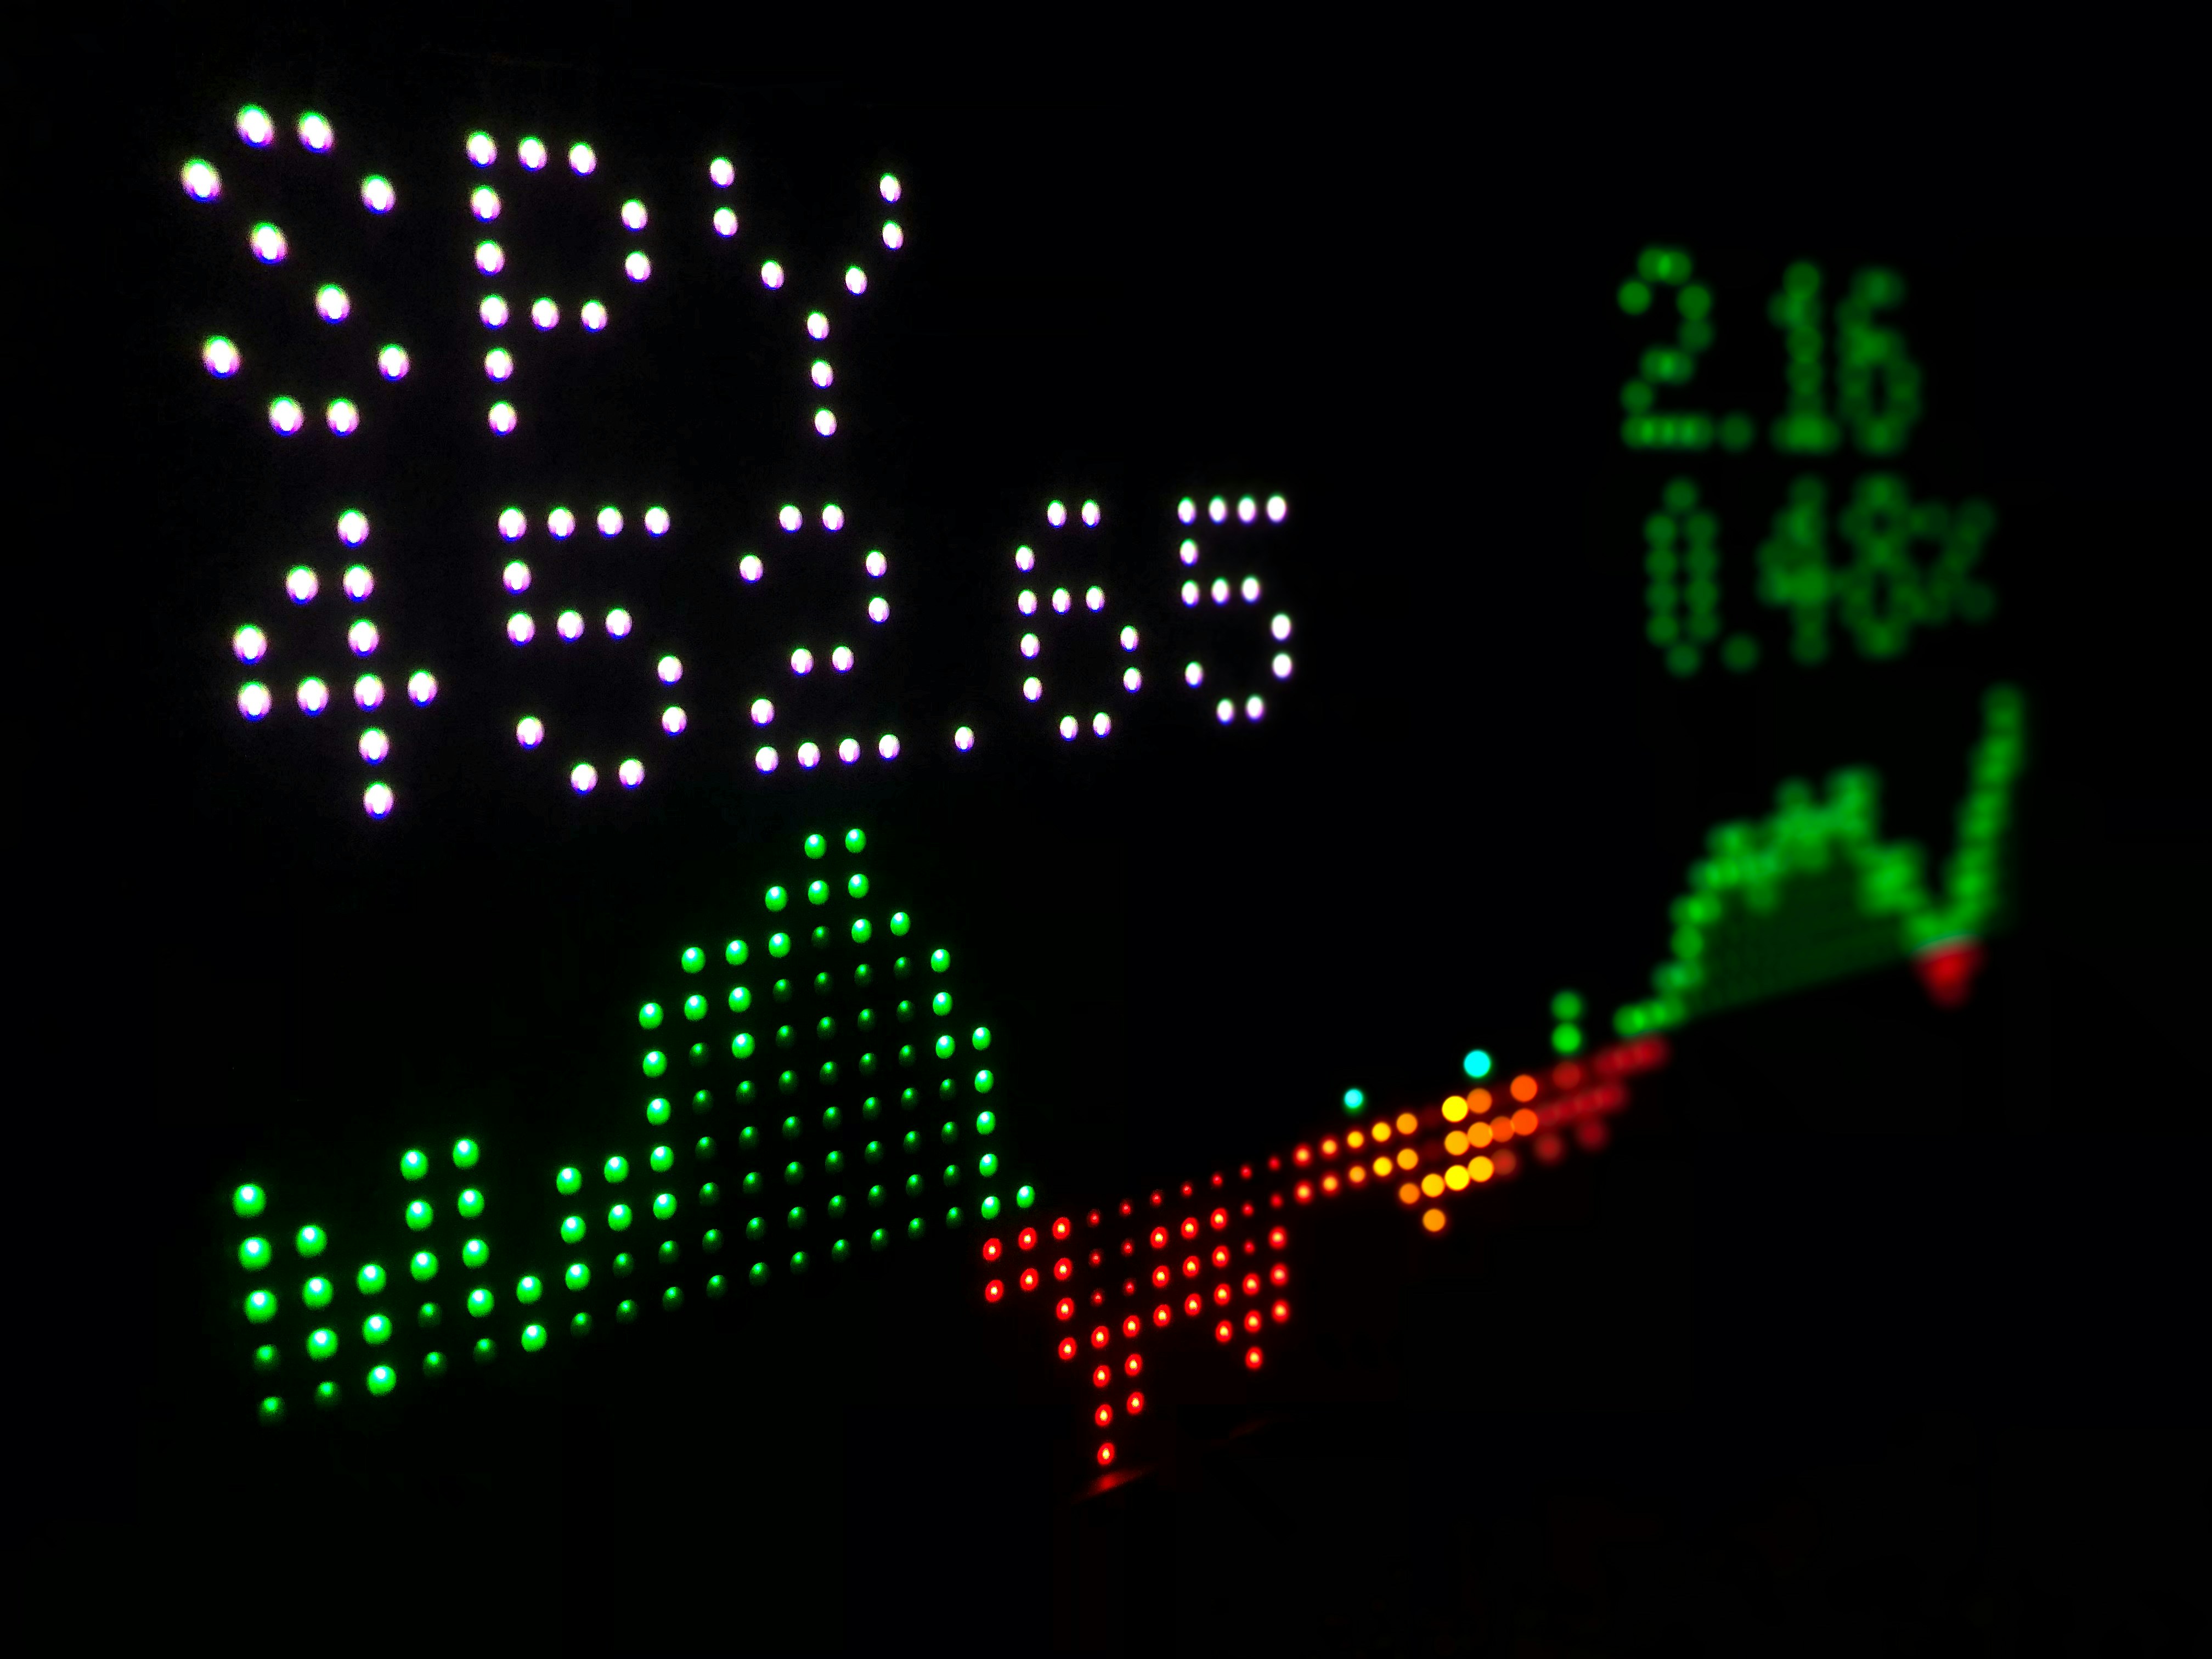
Has the stock market been giving you a bit of a boost lately? After months of volatility and tariff headlines, the market seems to be quietly sending us a noteworthy signal. This past Tuesday (7/2), the U.S. S&P500 index — representing the 500 large companies that best reflect the health of the American economy — triggered a major technical analysis event: the “Golden Cross.”
A lot of new investors hear terms like “Golden Cross” and “Death Cross” and feel a headache coming on — like it’s a secret martial arts manual. Don’t worry. Today I’ll break it down in plain “lazy language” so we can see what this signal actually means for us “Lazy to Be Rich” investors.
What Is a “Golden Cross”? It Sounds Impressive — But What Is It Really?
To understand the “Golden Cross,” we only need to understand two lines:
The Short-Term Moving Average
The 50-Day Moving Average (50MA or 50-day line): This represents the average cost of all investors in the market over “the most recent 50 trading days.” Because the timeframe is short, it reacts very sensitively to recent price changes — reflecting short-term market momentum.
The Long-Term Moving Average
The 200-Day Moving Average (200MA or the annual line): This represents the average cost over “the past 200 trading days.” Because it spans a long period, it moves slowly and smoothly — representing the long-term trend of the market.
The “Golden Cross” occurs when the agile “short-term average” crosses from below and surges powerfully above the “long-term average” that represents the broader trend.
Think of it this way: the market’s “short-term sentiment” has become extremely bullish, and that optimism is powerful enough to turn and pull the “long-term trend” upward. In technical analysis, this is generally regarded as a bullish signal, suggesting that a sustained upward move may be forming.

History Speaks: What Has the Market Done After a Golden Cross?
Words without data aren’t enough — let’s look at the numbers. According to Dow Jones Market Data going all the way back nearly a century to 1928:
| Time Range | Probability of Gain 1 Year After Golden Cross | Average Annualized Return |
|---|---|---|
| 1928 to present | 71% | 10% |
| Most recent 20 occurrences | 85% | 13% |
Those numbers sound pretty good, right? But remember — the market offers no 100% guarantees. Other bearish indicators can still exist. So a Golden Cross can raise your confidence, but it is not an absolute action trigger.
- Historical average: In the one year following a “Golden Cross,” the S&P500 has risen more than 71% of the time, with an average annualized return exceeding 10% — higher than the average return of any random 12-month period (roughly 8%).
- Recent performance: Looking at only the most recent 20 Golden Crosses, the data is even more striking. The probability of a market gain one year later jumps to 85%, with average gains exceeding 13%.
That’s why Wall Street analysts get so excited about this signal. Piper Sandler’s Chief Market Technician Craig Johnson stated: “This is absolutely a healthy sign for the market.”
Warning
Historical data is just history. A high probability does not guarantee profit. Please evaluate risk on your own.
More Than a Single Signal — This Golden Cross Is a Little Different
What makes this even more worth noting is that this Golden Cross didn’t show up alone.
Think back to the last time the S&P500 had a Golden Cross — February 2023. From then until now, the index has risen more than 48%! And this time around, beyond the S&P500, the tech-heavy Nasdaq and AI giant Nvidia have also recently triggered their own Golden Crosses. It’s as if the army, navy, and air force all flashed “advance” signals simultaneously — market breadth is expanding, and the rally is no longer limited to a handful of individual stocks.
Straight Talk for Lazy Investors: What Should We Actually Do?
After reading all this, you might be thinking: “Awesome! So it’s time to go all-in, right?”
Hold on.
As a rational lazy investor, our job is to “read the signal” — not to “act impulsively.”
Treat it as a “confidence booster,” not an “action trigger”: A Golden Cross is a lagging indicator, meaning it “confirms” that an uptrend has formed — it does not “predict” the entry point. If you already practice regular dollar-cost averaging into broad market ETFs (like VOO or SPY), this signal is saying: “Hey, your strategy is solid. The long-term market trend is on your side.” Keep following your discipline.
Review your asset allocation — don’t change your strategy: This is a great opportunity to look over your portfolio. But this doesn’t mean selling bonds and going full equity. Instead — does your stock-to-bond ratio still match your original target? Does anything need “rebalancing”?
Always respect the market — nothing in the market is 100%: News reports also note that some bearish indicators remain in place. No single indicator is a magic bullet. A “Golden Cross” greatly improves the “odds” of profitable investing — but it guarantees nothing. Remember: there are no magic bullets in the market. Staying rational and disciplined is what lets you go the distance.
Lazy Conclusion

In summary: the appearance of the “Golden Cross” is like your captain announcing during a long flight: “Ladies and gentlemen, we have reached cruising altitude. The air is smooth — please relax and enjoy the journey.”
You don’t need to unbuckle your seatbelt and sprint down the aisle. You just need to settle in a little more comfortably, a little more at ease, and keep enjoying the flight — heading steadily toward your wealth destination.
Wishing all of us the good fortune to lazily get rich on the rational road.
🚀 已有 1,000+ 讀者加入理財成長之路